Ok, mostly I am trying to avoid writing up the painful details of a proposed mathematics paper.
But I do follow elections relatively closely. In the California Democratic primary, CNN called the election for Hillary Clinton late on June 7; at the time she lead Bernie Sanders 1,940,588-1,502,043, which is a margin of 438,537 votes. Percentage wise, the lead was 55.8-43.2, or 12.6 percentage points.
But due to mail in balloting and provisional ballot counting, there were still many votes to count. As of this morning, the totals were:
2,360,266-1,887,178 for a numerical lead of 473,088 votes. Percentage wise, the lead was 55.1-44.0, or 11.1 percentage points.
So, the lead grew numerically, but shrunk percentage wise.
“Big deal”, you say? Well, from reading social media, it is not obvious (to some) how a lead can grow numerically but shrink as a percentage.
Conceptually, it is pretty easy to explain: suppose one has an election involving 1100 voters who MUST choose between candidates. Say the first 100 votes that are counted happened to come from a strongly pro-Hillary group, and the tally after 100 was 90 Hillary, 10 Bernie. Then suppose the next 1000 was closer, say 550 for Hillary and 450 for Bernie. Then the lead grew by 100 votes (80 to 180) but the percentage lead shrunk from 80 percentage points to a 16.36 percentage point lead (58.18 to 41.82 percent). And it is easy to see that if the rest of the vote was really 55 percent Hillary, her percent of the vote would asymptotically shrink to close to 55 percent as the number of votes counted went up.
So, how might one have students model it? Let be increasing functions of which represent the number of votes for Hillary and Bernie as a function of time. Assume no mistakes, hence can be assumed to be increasing functions. So we want a case there is an increasing function but decreases with time.
Without calculus: rewrite and note that decreases as increases; that is, as outgrows . But must continue to outgrow . That is, the new ballots must still include more Hillary Bernie ballots, but the ratio of Bernie ballots to Hillary ballots must be going down.
If we use some calculus, we see that must exceed but to make decrease, use the quotient rule plus a tiny bit of algebra to conclude that must be negative, or that . That is, the Bernie ballots must be growing at a higher percentage rate than the Hillary ballots are.
None of this is surprising, but it might let the students get a feel of what derivatives are and what proportional change means.
The International Mathematical Union (IMU) has revealed on its website the winners of the 2014 Fields medals, considered the highest honour in mathematics. The four young medallists — including Maryam Mirzakhani, the first female winner since the prizes were established in 1936 — have been selected for their contributions to topics ranging from dynamical systems to the geometry of numbers and the solution of equations of the type that describe many physical phenomena.
Of course, this is a big deal. But I should point out that all Fields Medalist are outliers in the extreme (similar to Nobel Laureates) and very, very distant from the bulk of mathematics professors. So, while I applaud this, I wonder if it will have any impact on the rank and file among college professors.
I am writing a paper and am through with the mathematics part. Now I have to organize, put in figures and, in general, make it readable. Or, in other words, the “fun” part is over. 🙂
So, I’ll go ahead and post some media articles which demonstrate mathematical or statistical concepts:
After a century of studying their tangled mathematics, physicists can tie almost anything into knots, including their own shoelaces and invisible underwater whirlpools. At least, they can now thanks to a little help from a 3D printer and some inspiration from the animal kingdom.
Physicists had long believed that a vortex could be twisted into a knot, even though they’d never seen one in nature or the even in the lab. Determined to finally create a knotted vortex loop of their very own, physicists at the University of Chicago designed a wing that resembles a delicately twisted ribbon and brought it to life using a 3D printer.
After submerging their masterpiece in water and using electricity to create tiny bubbles around it, the researchers yanked the wing forward, leaving a similarly shaped vortex in its wake. Centripetal force drew the bubbles into the center of the vortex, revealing its otherwise invisible, knotted structure and allowing the scientists to see how it moved through the fluid—an idea they hit on while watching YouTube videos of dolphins playing with bubble rings.
By sweeping a sheet of laser light across the bubble-illuminated vortex and snapping pictures with a high-speed camera, they were able to create the first 3D animations of how these elusive knots behave, they report today in Nature Physics. It turns out that most of them elegantly unravel within a few hundred milliseconds, like the trefoil-knotted vortex in the video above. […]
Note: the trefoil is the simplest of all of the non-trivial (really knotted) knots in that its projection has the fewest number of crossings, or in that it can be made with the fewest number of straight sticks.
I do have one quibble though: shoelaces are NOT knotted…unless the tips are glued together to make the lace a complete “circuit”. There ARE arcs in space that are knotted:
This arc can never be “straightened out” into a nice simple arc because of its bad behavior near the end points. Note: some arcs which have an “infinite number of stitches” CAN be straightened out. For example if you take an arc and tie an infinite number of shrinking trefoil knots in it and let those trefoil knots shrink toward an endpoint, the resulting arc can be straightened out into a straight one. Seeing this is kind of fun; it involves the use of the “lamp cord trick”
(this is from R. H. Bing’s book The Geometric Topology of 3-Manifolds; the book is chock full of gems like this.)
Social Issues
It is my intent to stay a-political here. But there are such things as numbers and statistics and ways of interpreting such things. So, here are some examples:
My testimony will amplify and support the following points:
A complete picture of time on welfare requires an understanding of two seemingly contradictory facts: the majority of families who ever use welfare do so for relatively short periods of time, but the majority of the current caseload will eventually receive welfare for relatively long periods of time.
It is a good mental exercise to see how this statement could be true (and it is); I invite you to try to figure this out BEFORE clicking on the link. It is a fun exercise though the “answer” will be obvious to some readers.
Speaking of Welfare: there is a debate on whether drug testing welfare recipients is a good idea or not. It turns out that, at least in terms of money saved/spent: it was a money losing proposition for the State of Florida, even when one factors in those who walked away prior to the drug tests. This data might make a good example. Also, there is the idea of a false positive: assuming that the statistic of, say, 3 percent of those on welfare use illegal drugs, how accurate (in terms of false positives) does a test have to be in order to have, say, a 90 percent predictive value? That is, how low does the probability of a false positive have to be for one to be 90 percent sure that someone has used drugs, given that they got a positive drug test?
Lastly: Social Security You sometimes hear: life expectancy was 62 when Social Security started. Well, given that working people pay into it, what are the key data points we need in order to determine what changes should be made? Note: what caused a shorter life expectancy and how does that effect: the percent of workers paying into it and the time that a worker draws from it? Think about these questions and then read what the Social Security office says. There are some interesting “conditional expectation” problems to be generated here.
First of all, I’d like to make it clear that I am unqualified to talk about teaching mathematics at the junior high and high school level. I am qualified to make comments on what sorts of skills the students bring with them to college.
But I am interested in issues affecting mathematics education and so will mention a couple of them.
1. California is moving away from having all 8’th graders take “algebra 1”. Note: I was in 8’th grade from 1972-1973. Our school was undergoing an experiment to see if 8’th graders could learn algebra 1. Being new to the school, I was put into the regular math class, but was quickly switched into the lone section of algebra 1. The point: it wasn’t considered “standard for everyone.”
My “off the cuff” remarks: I know that students mature at different rates and wonder if most are ready for the challenge by the 8’th grade. I also wonder about “regression to the mean” effects of having everyone take algebra 1; does that force the teacher to water down the course?
I read Epstein School head Stan Beiner’s guest column on what kids really need to know for college with great interest because one of the main goals of my 40-years as a college professor was to help my students make a successful transition from high school to college.
I taught thousands of freshmen in Introductory Psychology classes and Freshman Learning Communities, and I was constantly amazed by how many of them suffered from a severe case of “culture shock” when they moved from high school to college.
I used one of my assignments to identify these cultural differences by asking my students to create suggestions they would like to give their former high school teachers to help them better prepare their students for college. A content analysis of the results produced the following six suggestion summaries.
The underlying theme in all these suggestions is that my students firmly believed they would have been better prepared for college if their high school teachers had provided them with more opportunities to behave in the responsible ways that are required for success in higher education […]
You can surf to the article to read the suggestions. They are not surprising; they boil down to “be harder on us and hold us accountable.” (duh). But what is more interesting, to me, is some of the comments left by the high school teachers:
“I have tried to hold students accountable, give them an assignment with a due date and expect it turned in. When I gave them failing grades, I was told my teaching was flawed and needed professional development. The idea that the students were the problem is/was anathema to the administration.”
“hahahaha!! Hold the kids responsible and you will get into trouble! I worked at one school where we had to submit a written “game plan” of what WE were going to do to help failing students. Most teachers just passed them…it was easier. See what SGA teacher wrote earlier….that is the reality of most high school teachers.”
“Pressure on taechers from parents and administrators to “cut the kid a break” is intense! Go along to get along. That’s the philosophy of public education in Georgia.”
“It was the same when I was in college during the 80’s. Hindsight makes you wished you would have pushed yourself harder. Students and parents need to look at themselves for making excuses while in high school. One thing you forget. College is a choice, high school is not. the College mindset is do what is asked or find yourself another career path. High school, do it or not, there is a seat in the class for you tomorrow. It is harder to commit to anything, student or adult, if the rewards or consequences are superficial. Making you attend school has it advantages for society and it disadvantages.”
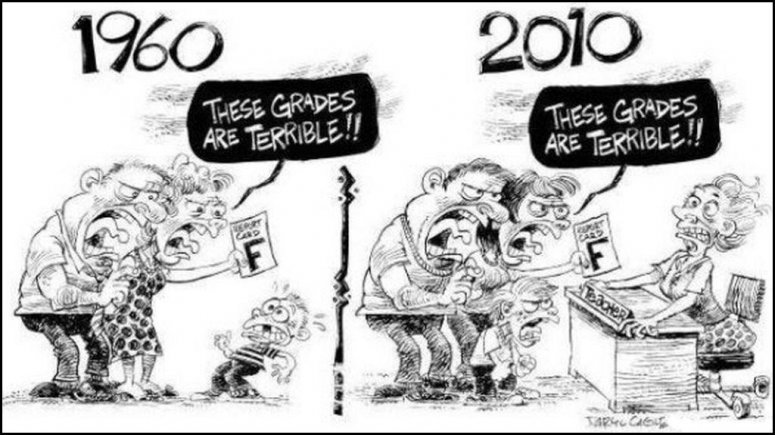
My two cents: it appears to me that too many of the high schools are adopting “the customer is always right” attitude with the student and their parents being “the customer”. I think that is the wrong approach. The “customer” is society, as a whole. After all, public schools are funded by everyone’s tax dollars, and not just the tax dollars of those who have kids attending the school. Sometimes, educating the student means telling them things that they don’t want to hear, making them do things that they don’t want to do, and standing up to the helicopter parents. But, who will stand up for the teachers when they do this?
Note: if you google “education then and now” (search for images) you’ll find the above cartoons translated into different languages. Evidently, the US isn’t alone.
This New England Journal of Medicine article takes a look at well known “factoids” about obesity, and how many of them don’t stand up to statistical scrutiny. (note: the article is behind a paywall, but if you are university faculty, you probably have access to the article via your library.
Note: this type of cipher is really an element of the group , the symmetric group on 26 letters. Never allowing a letter to go to itself reduced the possibilites to products of cycles that covered all of the letters.
I am reading The Better Angels of our Nature by Steven Pinker. Right now I am a little over 200 pages into this 700 page book; it is very interesting. The idea: Pinker is arguing that humans, over time, are becoming less violent. One interesting fact: right now, a random human is less likely to die violently than ever before. Yes, the last century saw astonishing genocides and two world wars. But: when one takes into account how many people there are in the world (2.5 billion in 1950, 6 billion right now) World War II, as horrific as it was, only ranks 9’th on the list of deaths due to deliberate human acts (genocides, wars, etc.) in terms of “percentage of the existing population killed in the event”. (here is Matthew White’s site)
But I have a ways to go in the book…but it is one I am eager to keep reading.
The purpose of this post is to talk about a bit of probability theory that occurs in the early part of the book. I’ll introduce it this way:
Suppose I select a 28 day period. On each day, say starting with Monday of the first week, I roll a fair die one time. I note when a “1” is rolled. Suppose my first “1” occurs Wednesday of the first week. Then answer this: “what is the most likely day that I obtain my NEXT “1”, or all days equally likely?”
Yes, it is true that on any given day, the probability of rolling a “1” is 1/6. But remember my question: “what day is most likely for the NEXT one?” If you have had some probability, the distribution you want to use is the geometric distribution, starting on Thursday of the next week.
So you can see, the mostly likely day for the next “1” is Thursday! Well, why not, say, Friday? Well, if Friday is the next 1, then this means that you got “any number but 1” on Thursday followed by a “1” on Friday, and the probability of that is . The probability of the next one being Saturday is and so on.
The point: if one is studying the distribution of events that have a Poisson distribution (probability ) on a given time period, the overall distribution of such events is likely to show up “clumped” rather than evenly spaced. For an example of this happening in sports, check this out.
Anyway, Pinker applies this principle to the outbreak of wars, mass killings and the like.
Paul Krugman has an article that talks about the economics concept of comparative statics which involves a bit of calculus. The rough idea is this: suppose we have something that is a function of two economics variables and we are on some level curve: at some point . Now if we, say, hold constant and vary by what happens to the level curve ? The answer is, of course, where is a small error that vanishes as goes to zero; this is just multi-variable calculus and the idea of differentials, tangent planes and partial derivatives. The upshot is that the change in , denoted by is approximately .
It isn’t every day that someone in the mainstream media brings up calculus.
One common mistake that people sometimes make when they model things is the mistake of overfitting known results to past data.
Life is complicated, and if one wants to find a correlation of outcomes with past conditions, it really isn’t that hard to do.
Here Nate Silver calls out a case of overfitting; in this case someone has a model that is supposed to be able to predict the outcome of a presidential election. It has been “proven” right in the past.
If there are, say, 25 keys that could defensibly be included in the model, and you can pick any set of 13 of them, that is a total of 5,200,300 possible combinations. It’s not hard to get a perfect score when you have that large a menu to pick from! Some of those combinations are going to do better than others just by chance alone.
In addition, as I mentioned, at least a couple of variables can credibly be scored in either direction for each election. That gives Mr. Lichtman even more flexibility. It’s less that he has discovered the right set of keys than that he’s a locksmith and can keep minting new keys until he happens to open all 38 doors.
By the way — many of these concerns also apply to models that use solely objective data, like economic variables. These models tell you something, but they are not nearly as accurate as claimed when held up to scrutiny. While you can’t manipulate economic variables — you can’t say that G.D.P. growth was 5 percent when the government said it was 2 percent, at least if anyone is paying attention — you can choose from among dozens of economic variables until you happen to find the ones that pick the lock.
These types of problems, which are technically known as overfitting and data dredging, are among the most important things you ought to learn about in a well-taught econometrics class — but many published economists and political scientists seem to ignore them when it comes to elections forecasting.
In short, be suspicious of results that seem too good to be true. I’m probably in the minority here, but if two interns applied to FiveThirtyEight, and one of them claimed to have a formula that predicted 33 of the last 38 elections correctly, and the other one said they had gotten all 38 right, I’d hire the first one without giving it a second thought — it’s far more likely that she understood the limitations of empirical and statistical analysis.
I’d recommend reading the rest of the article. The point isn’t that the model won’t be right this time; in fact if one goes by the current betting market, there is about a 50 percent chance (slightly higher) that it will be right. But that doesn’t mean that it is useful.
The p-value puts a number on the effects of randomness. It is the probability of seeing a positive experimental outcome even if your hypothesis is wrong. A long-standing convention in many scientific fields is that any result with a p-value below 0.05 is deemed statistically significant. An arbitrary convention, it is often the wrong one. When you make a comparison of an ineffective drug to a placebo, you will typically get a statistically significant result one time out of 20. And if you make 20 such comparisons in a scientific paper, on average, you will get one significant result with a p-value less than 0.05—even when the drug does not work.
Many scientific papers make 20 or 40 or even hundreds of comparisons. In such cases, researchers who do not adjust the standard p-value threshold of 0.05 are virtually guaranteed to find statistical significance in results that are meaningless statistical flukes. A study that ran in the February issue of the American Journal
of Clinical Nutrition tested dozens of compounds and concluded that those found in blueberries lower the risk of high blood pressure, with a p-value of 0.03. But the researchers looked at so many compounds and made so many comparisons (more than 50), that it was almost a sure thing that some of the p-values in the paper would be less than 0.05 just by chance.
The same applies to a well-publicized study that a team of neuroscientists once conducted on a salmon. When they presented the fish with pictures of people expressing emotions, regions of the salmon’s brain lit up. The result was statistically significant with a p-value of less than 0.001; however, as the researchers argued, there are so many possible patterns that a statistically significant result was virtually guaranteed, so the result was totally worthless. p-value notwithstanding, there was no way that the fish could have reacted to human emotions. The salmon in the fMRI happened to be dead.
Emphasis mine.
Moral: one can run an experiment honestly and competently and analyze the results competently and honestly…and still get a false result. Damn that randomness!


 , the symmetric group on 26 letters. Never allowing a letter to go to itself reduced the possibilites to products of cycles that covered all of the letters.
 . The probability of the next one being Saturday is
  and so on.
  ) on a given time period, the overall distribution of such events is likely to show up “clumped” rather than evenly spaced. For an example of this happening in sports,
  and we are on some level curve:
  at some point
  . Now if we, say, hold
  constant and vary
  by
by  what happens to the level curve
  ? The answer is, of course,
  where
where  is a small error that vanishes as
  , denoted by
  is approximately
  .
.